Unit test reports
DETAILS: Tier: Free, Premium, Ultimate Offering: GitLab.com, Self-managed, GitLab Dedicated
It is very common that a CI/CD pipeline contains a test job that verifies your code. If the tests fail, the pipeline fails and users get notified. The person that works on the merge request has to check the job logs and see where the tests failed so that they can fix them.
You can configure your job to use Unit test reports, and GitLab displays a report on the merge request so that it's easier and faster to identify the failure without having to check the entire log. Unit test reports currently only support test reports in the JUnit report format.
If you don't use merge requests but still want to see the unit test report output without searching through job logs, the full Unit test reports are available in the pipeline detail view.
Consider the following workflow:
- Your default branch is rock solid, your project is using GitLab CI/CD and your pipelines indicate that there isn't anything broken.
- Someone from your team submits a merge request, a test fails and the pipeline gets the known red icon. To investigate more, you have to go through the job logs to figure out the cause of the failed test, which usually contain thousands of lines.
- You configure the Unit test reports and immediately GitLab collects and exposes them in the merge request. No more searching in the job logs.
- Your development and debugging workflow becomes easier, faster and efficient.
How it works
First, GitLab Runner uploads all JUnit report format XML files as artifacts to GitLab. Then, when you visit a merge request, GitLab starts comparing the head and base branch's JUnit report format XML files, where:
- The base branch is the target branch (usually the default branch).
- The head branch is the source branch (the latest pipeline in each merge request).
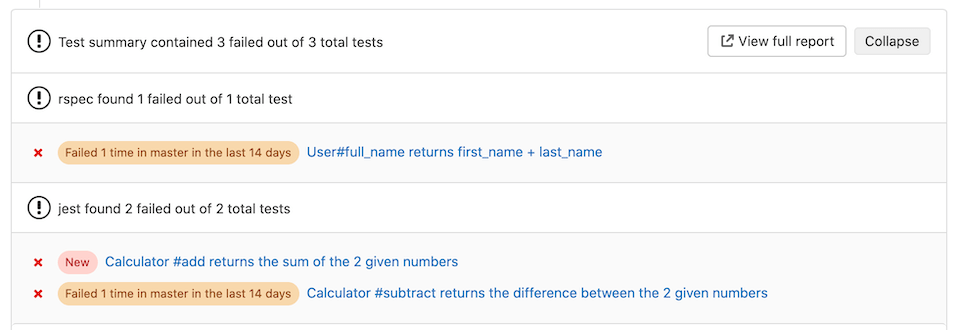
The Test summary panel shows how many tests failed, how many had errors, and how many were fixed. If no comparison can be done because data for the base branch is not available, the panel shows only the list of failed tests for the source branch.
The types of results are:
- Newly failed tests: Test cases which passed on the base branch and failed on the head branch.
- Newly encountered errors: Test cases which passed on the base branch and failed due to a test error on the head branch.
- Existing failures: Test cases which failed on the base branch and failed on the head branch.
- Resolved failures: Test cases which failed on the base branch and passed on the head branch.
View failed tests
Each entry in the Test summary panel shows the test name and result type. Select the test name to open a modal window with details of its execution time and the error output.
Copy failed test names
- Introduced in GitLab 15.2.
You can copy the name and path of failed tests when there are failed tests listed in the Test summary panel. Use name and path to find and rerun the test locally for verification.
To copy the name of all failed tests, at the top of the Test summary panel,
select Copy failed tests. The failed tests are listed as a string with the tests
separated by spaces. This option is only available if the JUnit report populates
the <file> attributes for failed tests.
To copy the name of a single failed test:
- Expand the Test summary panel by selecting Show test summary details ({chevron-lg-down}).
- Select the test you want to review.
- Select Copy test name to rerun locally ({copy-to-clipboard}).
Number of recent failures
- Introduced in merge requests in GitLab 13.7.
- Feature flag removed in GitLab 13.8.
- Introduced in Test Reports in GitLab 13.9.
If a test failed in the project's default branch in the last 14 days, a message like
Failed {n} time(s) in {default_branch} in the last 14 days is displayed for that test.
The calculation includes failed tests in completed pipelines, but not blocked pipelines. Issue 431265 proposes to also include blocked pipelines in the calculation.
How to set it up
To enable the Unit test reports in merge requests, you must add
artifacts:reports:junit
in .gitlab-ci.yml, and specify the paths of the generated test reports.
The reports must be .xml files, otherwise GitLab returns an Error 500.
In the following example for Ruby, the job in the test stage runs and GitLab
collects the unit test report from the job. After the job is executed, the
XML report is stored in GitLab as an artifact, and the results are shown in the
merge request widget.
## Use https://github.com/sj26/rspec_junit_formatter to generate a JUnit report format XML file with rspec
ruby:
  stage: test
  script:
    - bundle install
    - bundle exec rspec --format progress --format RspecJunitFormatter --out rspec.xml
  artifacts:
    when: always
    paths:
      - rspec.xml
    reports:
      junit: rspec.xml
To make the Unit test report output files browsable, include them with the
artifacts:paths keyword as well, as shown in the example.
To upload the report even if the job fails (for example if the tests do not pass),
use the artifacts:when:always keyword.
You cannot have multiple tests with the same name and class in your JUnit report format XML file.
In GitLab 15.0 and earlier, test reports from parallel:matrix jobs are aggregated together, which can cause some report information to not be displayed. In GitLab 15.1 and later, this bug is fixed, and all report information is displayed.
View Unit test reports on GitLab
- Introduced in GitLab 12.5 behind a feature flag (
junit_pipeline_view), disabled by default.- Feature flag removed in GitLab 13.3.
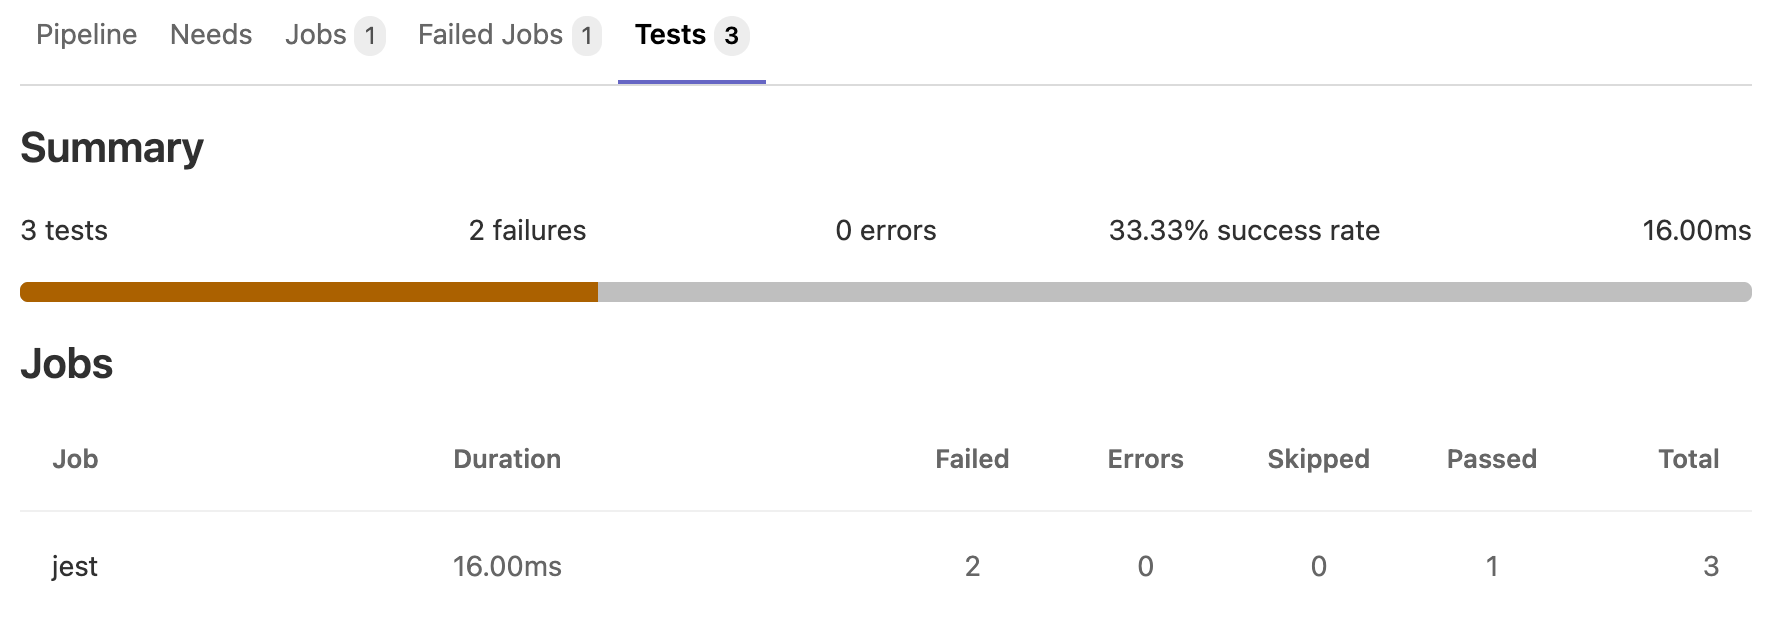
If JUnit report format XML files are generated and uploaded as part of a pipeline, these reports can be viewed inside the pipelines details page. The Tests tab on this page displays a list of test suites and cases reported from the XML file.
You can view all the known test suites and select each of these to see further details, including the cases that make up the suite.
You can also retrieve the reports via the GitLab API.
Unit test reports parsing errors
- Introduced in GitLab 13.10.
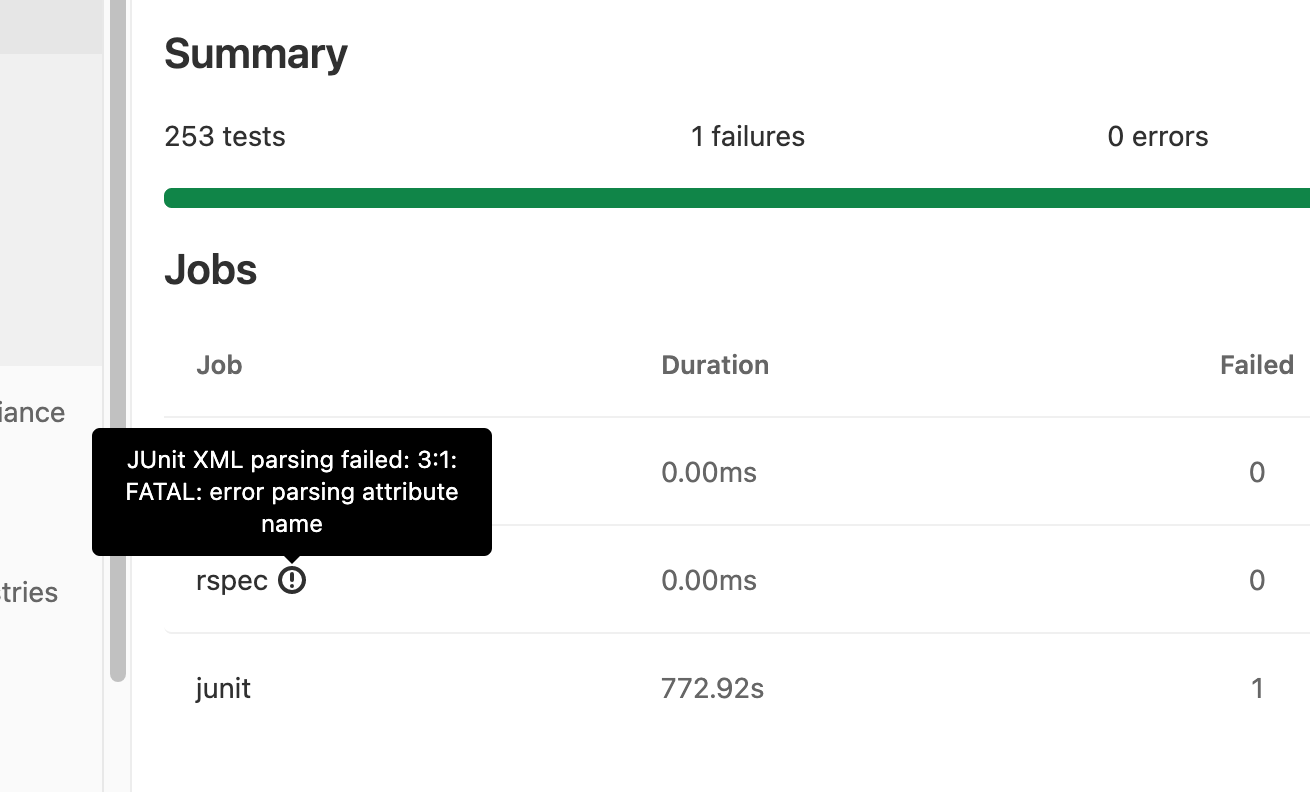
If parsing JUnit report XML results in an error, an indicator is shown next to the job name. Hovering over the icon shows the parser error in a tooltip. If multiple parsing errors come from grouped jobs, GitLab shows only the first error from the group.
For test case parsing limits, see Max test cases per unit test report.
GitLab does not parse very large nodes of JUnit reports. There is an issue open to make this optional.
View JUnit screenshots on GitLab
- Introduced in GitLab 13.0 behind the
:junit_pipeline_screenshots_viewfeature flag, disabled by default.- Feature flag removed in GitLab 13.12.
You can upload your screenshots as artifacts to GitLab.
If JUnit report format XML files contain an attachment tag, GitLab parses the attachment.
When uploading screenshot artifacts:
-
The
attachmenttag must contain the relative path to$CI_PROJECT_DIRof the screenshots you uploaded. For example:<testcase time="1.00" name="Test"> <system-out>[[ATTACHMENT|/path/to/some/file]]</system-out> </testcase> -
You should set the job that uploads the screenshot to
artifacts:when: alwaysso that it still uploads a screenshot when a test fails.
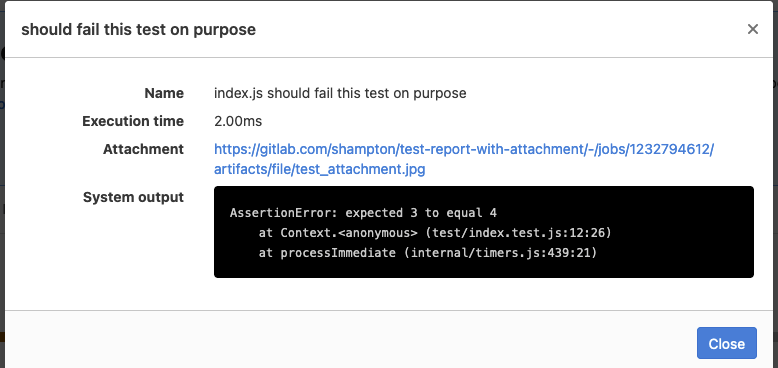
After the attachment is uploaded, the pipeline test report contains a link to the screenshot, for example:
Troubleshooting
Test report appears empty
A unit test report can appear to be empty when viewed in a merge request
if the artifact that contained the report expires.
If the artifact frequently expires too early, set a longer expire_in value for
the report artifact.
Alternatively, you can run a new pipeline to generate a new report.


